Circuit Dashboard
- With the circuit dashboard you are able to view the circuit state of a deployed project.
- It displays information such as the operational status of Pods, the progress of Pipelines, and logs.
- A Pod is the smallest execution unit in Kubernetes and contains one or more containers.
- For information on Pipelines, please refer to this page .
- A Pod is the smallest execution unit in Kubernetes and contains one or more containers.
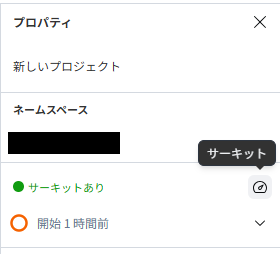
How to access
There are two quick ways to access the dashboard:
- Select the
Circuittab in the project sidebar.
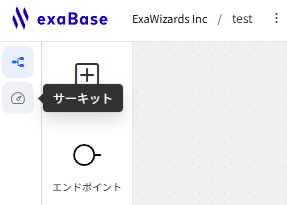
- Click the
Circuitbutton on the property panel.
Pod Phase
The phase of a Kubernetes Pod shows its current lifecycle state. The types of phases and their descriptions are as follows.
| Pod Phases | explanation |
|---|---|
| Pending | The Pod has been scheduled, but one or more containers have not yet started. |
| Running | All containers have been created, and at least one container is running. |
| Succeeded | All containers have finished, and the task is complete. |
| Failed | One or more containers have terminated abnormally. |
| Unknown | The Pod status cannot be obtained. |
Pods Tab
- The Pods tab lets you manage and monitor the status and logs of each Pod from one place.
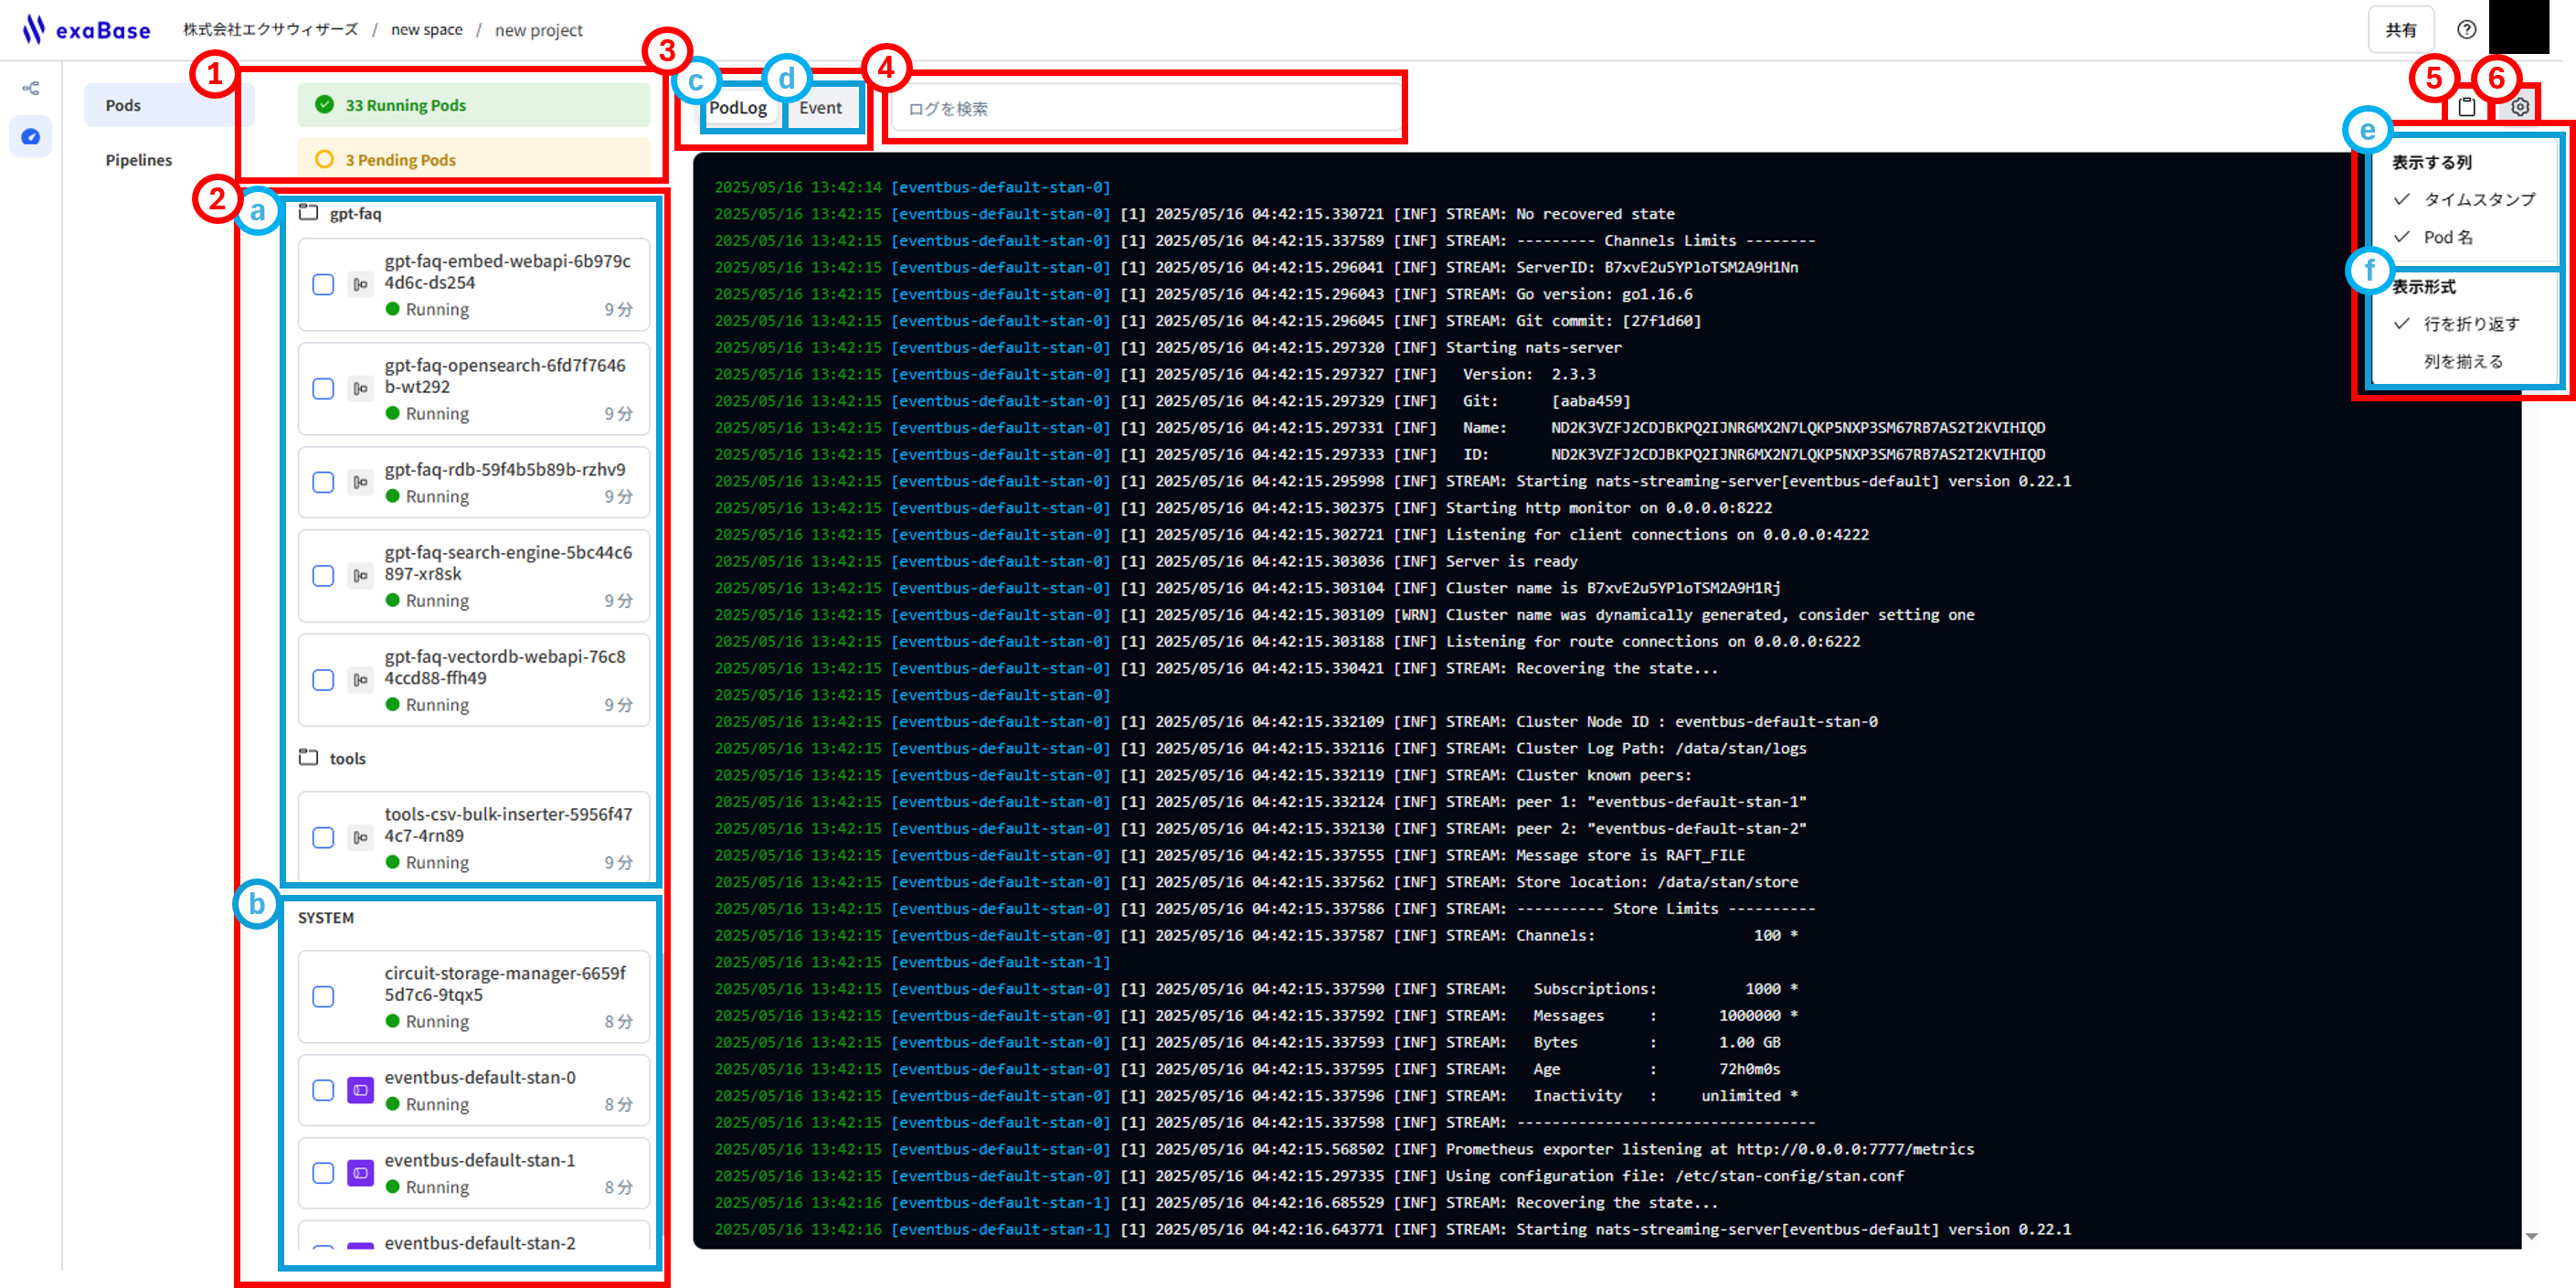
1.Pod Phases
Displays the current count of Pods in each lifecycle phase .
Check the Event log to gain deeper insight into your Pods, their status changes, and any underlying issues.
2.Pods List
The Pods list shows every active Pod in the namespace.
By default, the log panel streams logs from the entire namespace.
Click a Pod to filter the panel to its logs, or use the check-boxes to select multiple Pods and display their logs merged in chronological order.
Pod names follow this convention:
[Workspace name]-[Component name]-[Hash value]
Pods are generated in the following units and displayed in the Pods list.
| Unit | Details of Generated Pods |
|---|---|
| Component | One Pod for each: Entity, Trigger, Pipeline, and SideApp |
| System | If a Pipeline exists, for each project (canvas), one eventsource Pod, one circuit-storage-manager Pod, and three eventbus Pods are generated. |
-
a.Workspace Pods
Pods are displayed grouped by workspace.
-
b.SYSTEM Pods
System-related Pods are grouped together and displayed at the end of the Pods list.
3.Logs
Logs are displayed based on the Pod(s) selected.
-
c.PodLog
View the logs of the containers running in selected Pods.
-
d.Event
View events of the selected Pods.
4.Search Logs
Enter a keyword to display logs that contain it. If you select one or more Pods, the search will be restricted to logs from those Pods.
5.Copy Logs
You can copy the logs currently displayed in the log panel to your clipboard.
6.Display Options
Customize how logs appear in the panel.
-
e.Column Visibility
- Enable
Timestampto show the log time in green on the left. - Enable
Pod nameto show the Pod name in blue on the left.
- Enable
-
f.Display Format
- Enable
Wrap linesto wrap long log messages onto the next line. - Enable
Align columnsto align the start of all log messages.
- Enable
Pipelines Tab
The Pipelines tab lists the Pods involved in the Pipelines Workflow and lets you monitor their logs.
Many features are shared with the Pods tab, please refer to it as well.
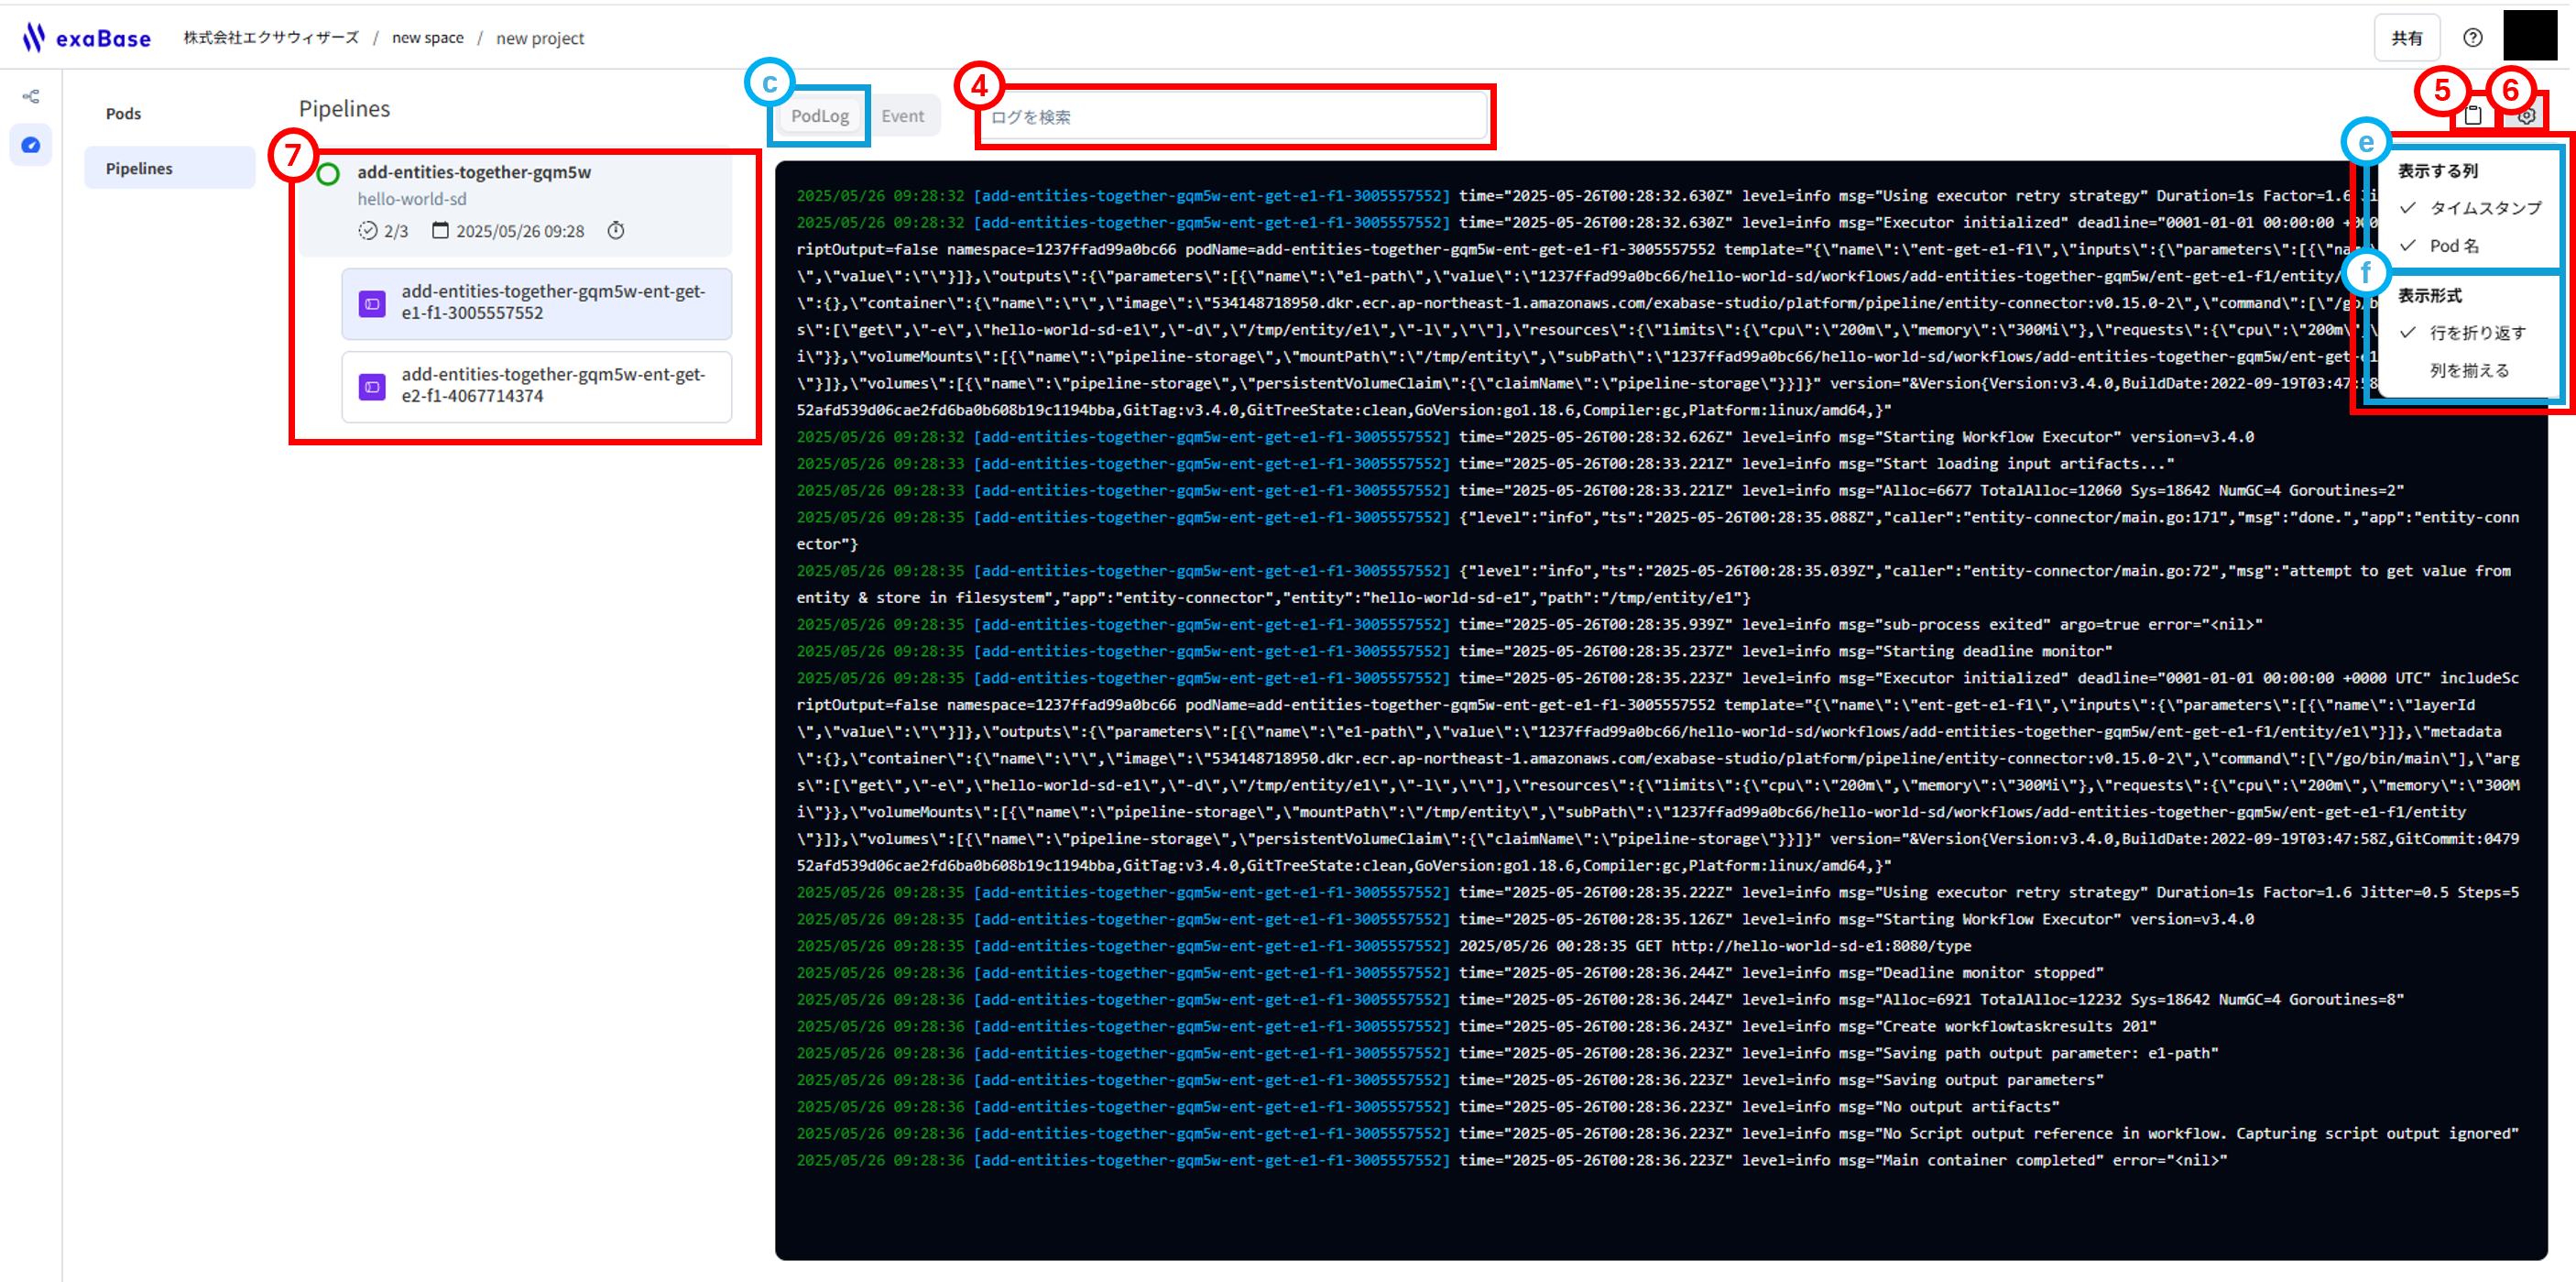
7.Workflow List
For each Workflow, its progress, start time, and elapsed time are displayed.
The Workflow phase indicates the current lifecycle stage of the Workflow, as described below.
| Workflow Phase | Icon | Description |
|---|---|---|
| Pending | Processing has not started and is queued to begin. | |
| Running | Processing is currently underway. | |
| Succeeded | All steps have completed successfully. | |
| Failed | Processing finished, but one or more steps have failed. |
-
By clicking a Workflow, the list of Pods related to that Workflow is displayed. You can then click a Pod to view the logs for that Pod in the log panel.
-
If Workflow history exists, it will display up to 100 runs within the past 24 hours, regardless of the circuit’s current running state.